
Home ownership has been part of the American dream since the 1800s. At that time the wealthy could of course afford to buy their own properties, but many other classes could not afford to do so. Immigrants, domestic servants, farmers, and former enslaved peoples had to rent or engage in tenant farming. But, with the westward expansion and the Homestead Act of 1862 owning your own land became part of the vision for many more people. At that time people built whatever homes they had the funds for, often residing in lean-tos until a more suitable house could be constructed.
19th century homesteaders had to show up and work the land to gain the deed, but in the 20th century families had to save up to buy a home and what they paid over the next century changed dramatically. Here’s how much money it took to become a homeowner over the past 100 years and how that price compared to the average household income at the time.
1920s
According to the IRS the average net income in 1920 was $3,270. Of course the Stock Market Crash of 1929 changed things for a lot of people. But, for much of the decade the middle and upper classes enjoyed rising prospects and an ever-increasing standard of living.
The average home price was varied between $4,938 and $6,296, which means that if you had an average salary and bought a lower value home the cost of that home would be about 1.5 times one year’s income before any property taxes, fees, insurance, and upkeep.
But, you could also buy a kit home for between $1,000 and $2,500. The cost of labor to build the house, amenities, and the land to build on would have been extra.
1930s
In the 1930s the Great Depression affected everyone. Many families could no longer afford to pay their mortgages and some gave up their dreams of owning homes altogether. Things looked bleak, but thanks in part to the New Deal by the end of the decade home ownership was again a possibility and some families were even buying new houses.
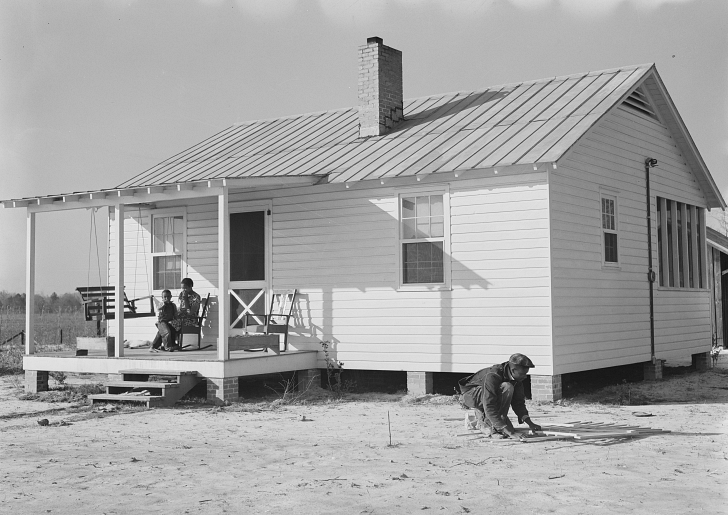
The average yearly salary during much of the decade was only $1,524 (though some estimates as as high as $1,970) and the cost of buying a home was around $3,835. The amount to buy a home was between 2 and 2.5 times the household’s yearly income.
1940s
During the beginning of the World War II years many families were doing better, but still saved money wherever they could. But, this all changed after the war was over when the US was optimistically looking forward.
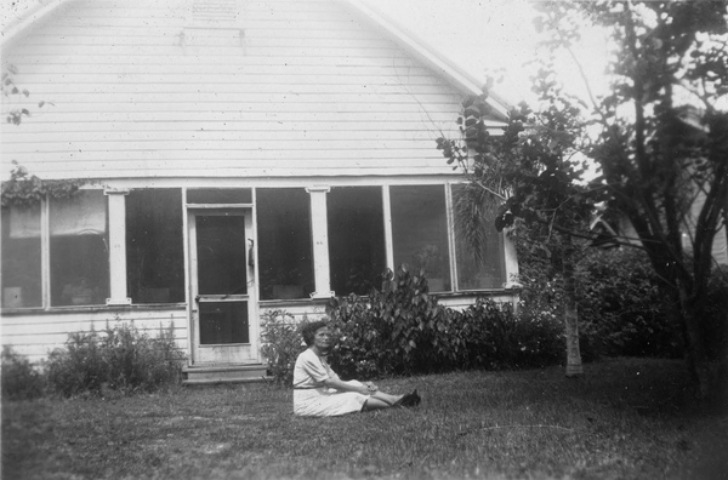
The average household income was around $1,725 on 1940 and by 1949 had risen to $2,950. The after effects of the Depression and the work force being significantly female (and thus paid less) during the war accounts for the stagnation of wages early in the decade. The average cost of a house during in 1940 was $3,920. 2.25x the average annual income was the cost of a home at this time.
Returning soldiers were incentivized to buy newly-constructed suburban homes with low interest rates, making home buying even more affordable.
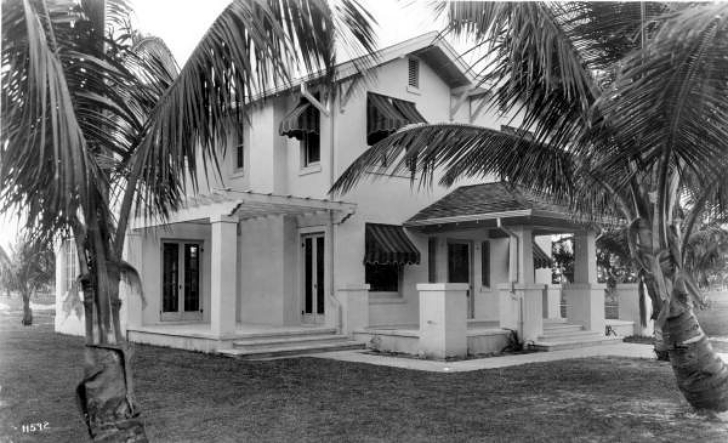
1950s
During the 1950s the household income rose to $4,237 and the cost of buying a home was around $8,450 (though the median home price was $1,000 lower). This means that a home cost might be about 2 years worth of your household income.
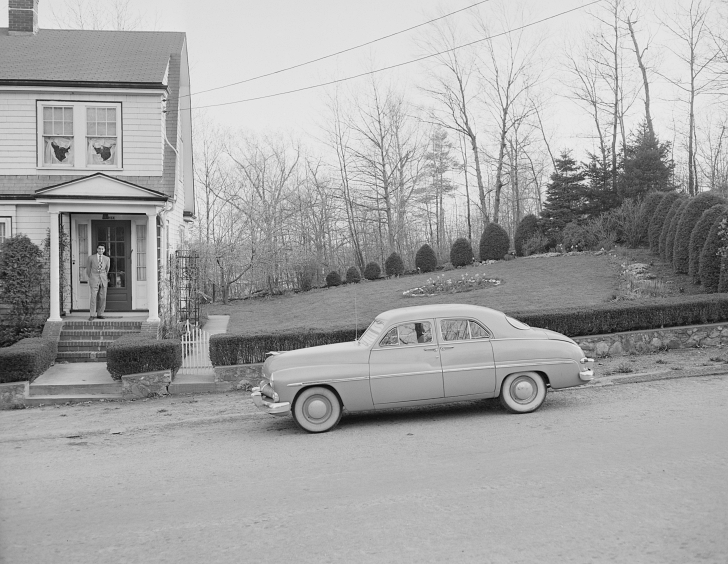
New construction was abundant during this era and many families got to experience what being the first owners of a well-equipped house felt like.
1960s
The average household income in 1960 was $6,691 and the average house price was $12,700 (median was $11,900). At that rate it would have take 1.9x your yearly income to buy a home. Space-age and ultra modern houses began to come up for sale during the 1960s and personal style was becoming a factor for many homebuyers.
The chic finishes of the 1960s still catered to the traditional model of family where the husband worked, the wife was a homemaker, and the couple had 2.5 children. But, the choice of houses meant that families could be picky about which home they bought.
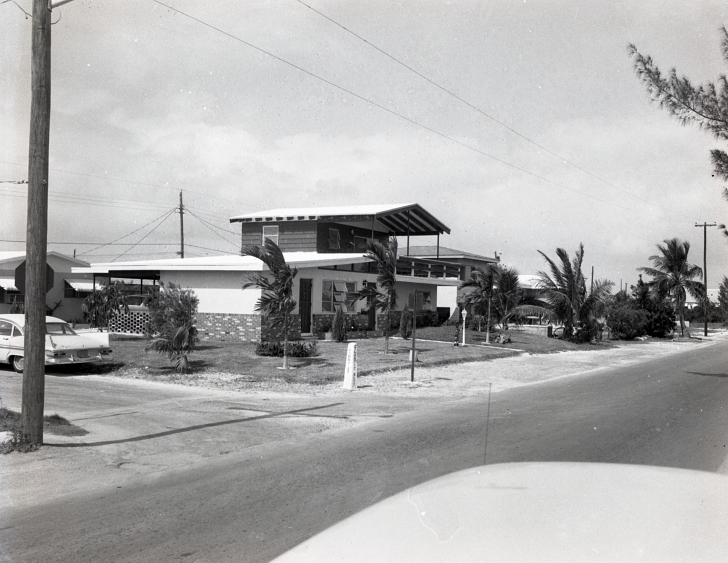
1970s
In 1970 the average household income was $9,731 and the average home price was $23,450 (median was $17,000). During the course of the decade home values were increasing and interest rates were low, making property a good investment. It took 2.4 times the family yearly income to buy a house at this time.
Housing prices shot up by as much as 50% in some cases towards the end of the decade.
1980s
During the 1980s the incomes increased dramatically depending on which profession you were in. By 1985 the average household income was $23,464 and the median home price was $82,800- that’s 3.5 years of a family’s income to buy a home.
Of course, where one lived impacted home values quite a bit. Many areas were hit hard by the recession of the early 1980s that began with the Energy Crisis of 1979. Despite the rise of the well-paid yuppie during the second half of the 1980s, in some areas wages remained stagnant and housing values suboptimal.
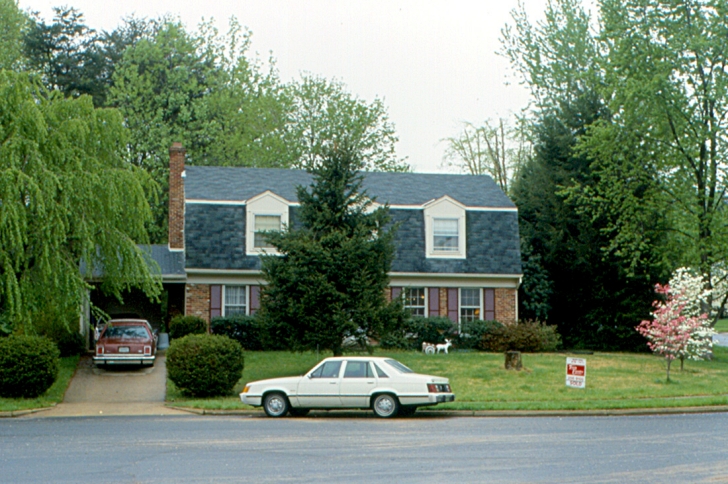
1990s
In 1990 the average household income was $29,943 and the median house price was $79,100 making the cost of buying a house about 2.64x the yearly income. By 1996 the average household income had risen to $35,787 and with it the cost of buying a home increased to $140,000 (or nearly 4x annual income).
2000s
In 2000 the median home price was $119,600 and the median household income was $55,030, That’s 2.17 times the annual income needed to buy a house. And, home prices were on the rise for much of the decade, rising to $205,700 by 2007.
But, as we all know the housing bubble burst in 2008 causing massive unemployment and chronic under employment. Unemployment rates rose to between 7% and 12% depending on ethnicity and region during the worst of the bust.
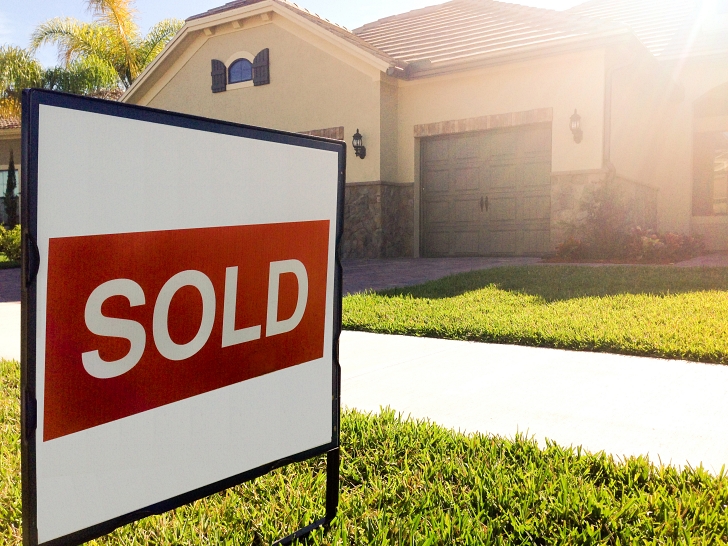
2010s-Present
Home prices have been on an upward trend the past few years, with some seemingly-average homes in some markets soaring to prices that only 6-figure executives can afford. In 2010 the median household income was $49,445, down from just ten years before. The median home price was $221,800 or nearly 4.5 years worth of earnings at the average income level.
By 2019 that number rose to $68,703. In spring of 2021 the median cost of a house rose to $329,100 while the median household income is $79,900. However, as the desirability of home ownership has gone up in since the pandemic began the average home price has risen to $397,800.
This means that in a modestly-priced area homes can cost as little as 20% of yearly household income. But, in tech boom areas, like Seattle and San Francisco, those who already own their homes have seen an increase in equity that outstrips the average income of an Amazon programmer ($104,000 or more). Those looking to buy a home in these inflated markets can expect to pay $1M or more for houses that in other areas may cost only a third of that. For the aforementioned programmer in this scenario that’s nearly 10 years worth of their salary as the asking price, a steep incline from pre-1990s housing prices.
More to Explore
SKM: below-content placeholderWhizzco for DOT